
Maturity is realizing that building systems is fundamentally about how we use CPU, memory, and disk to get things done. This is first-principles thinking. The ability to reason about CPU, memory, and disk as foundational components in our thought process is itself the power of abstraction. We owe this to the developers who took on the cognitive burden of building these low-level abstractions, allowing us to focus on business software needs rather than getting lost in the complexities of compilers, opcodes, registers, capacitors, clocks, and so on.
Even if we move a few steps up the abstraction hierarchy and enter the realm of operating systems, we still find that the responsibilities of the software on which our applications run are highly complex. The way an OS manages processes, memory, disk, and security is remarkable. The fact that millions of machines run Linux distributions today is a testament to its efficiency and reliability. It enables developers to focus on building what customers need without worrying too much about the underlying architecture.
One could argue that electronic chips and operating systems are themselves products with their own businesses and customers - and this is undeniably true. However, in this context, the terms business and customers refer specifically to organizations that provide Software as a Service (SaaS) and their end users. In this blog, we will explore how each component in a SaaS architecture can impact overall performance and examine ways to uncover hidden bottlenecks by considering compute, memory, and disk as the fundamental sources of root causes.
The Sample Architecture
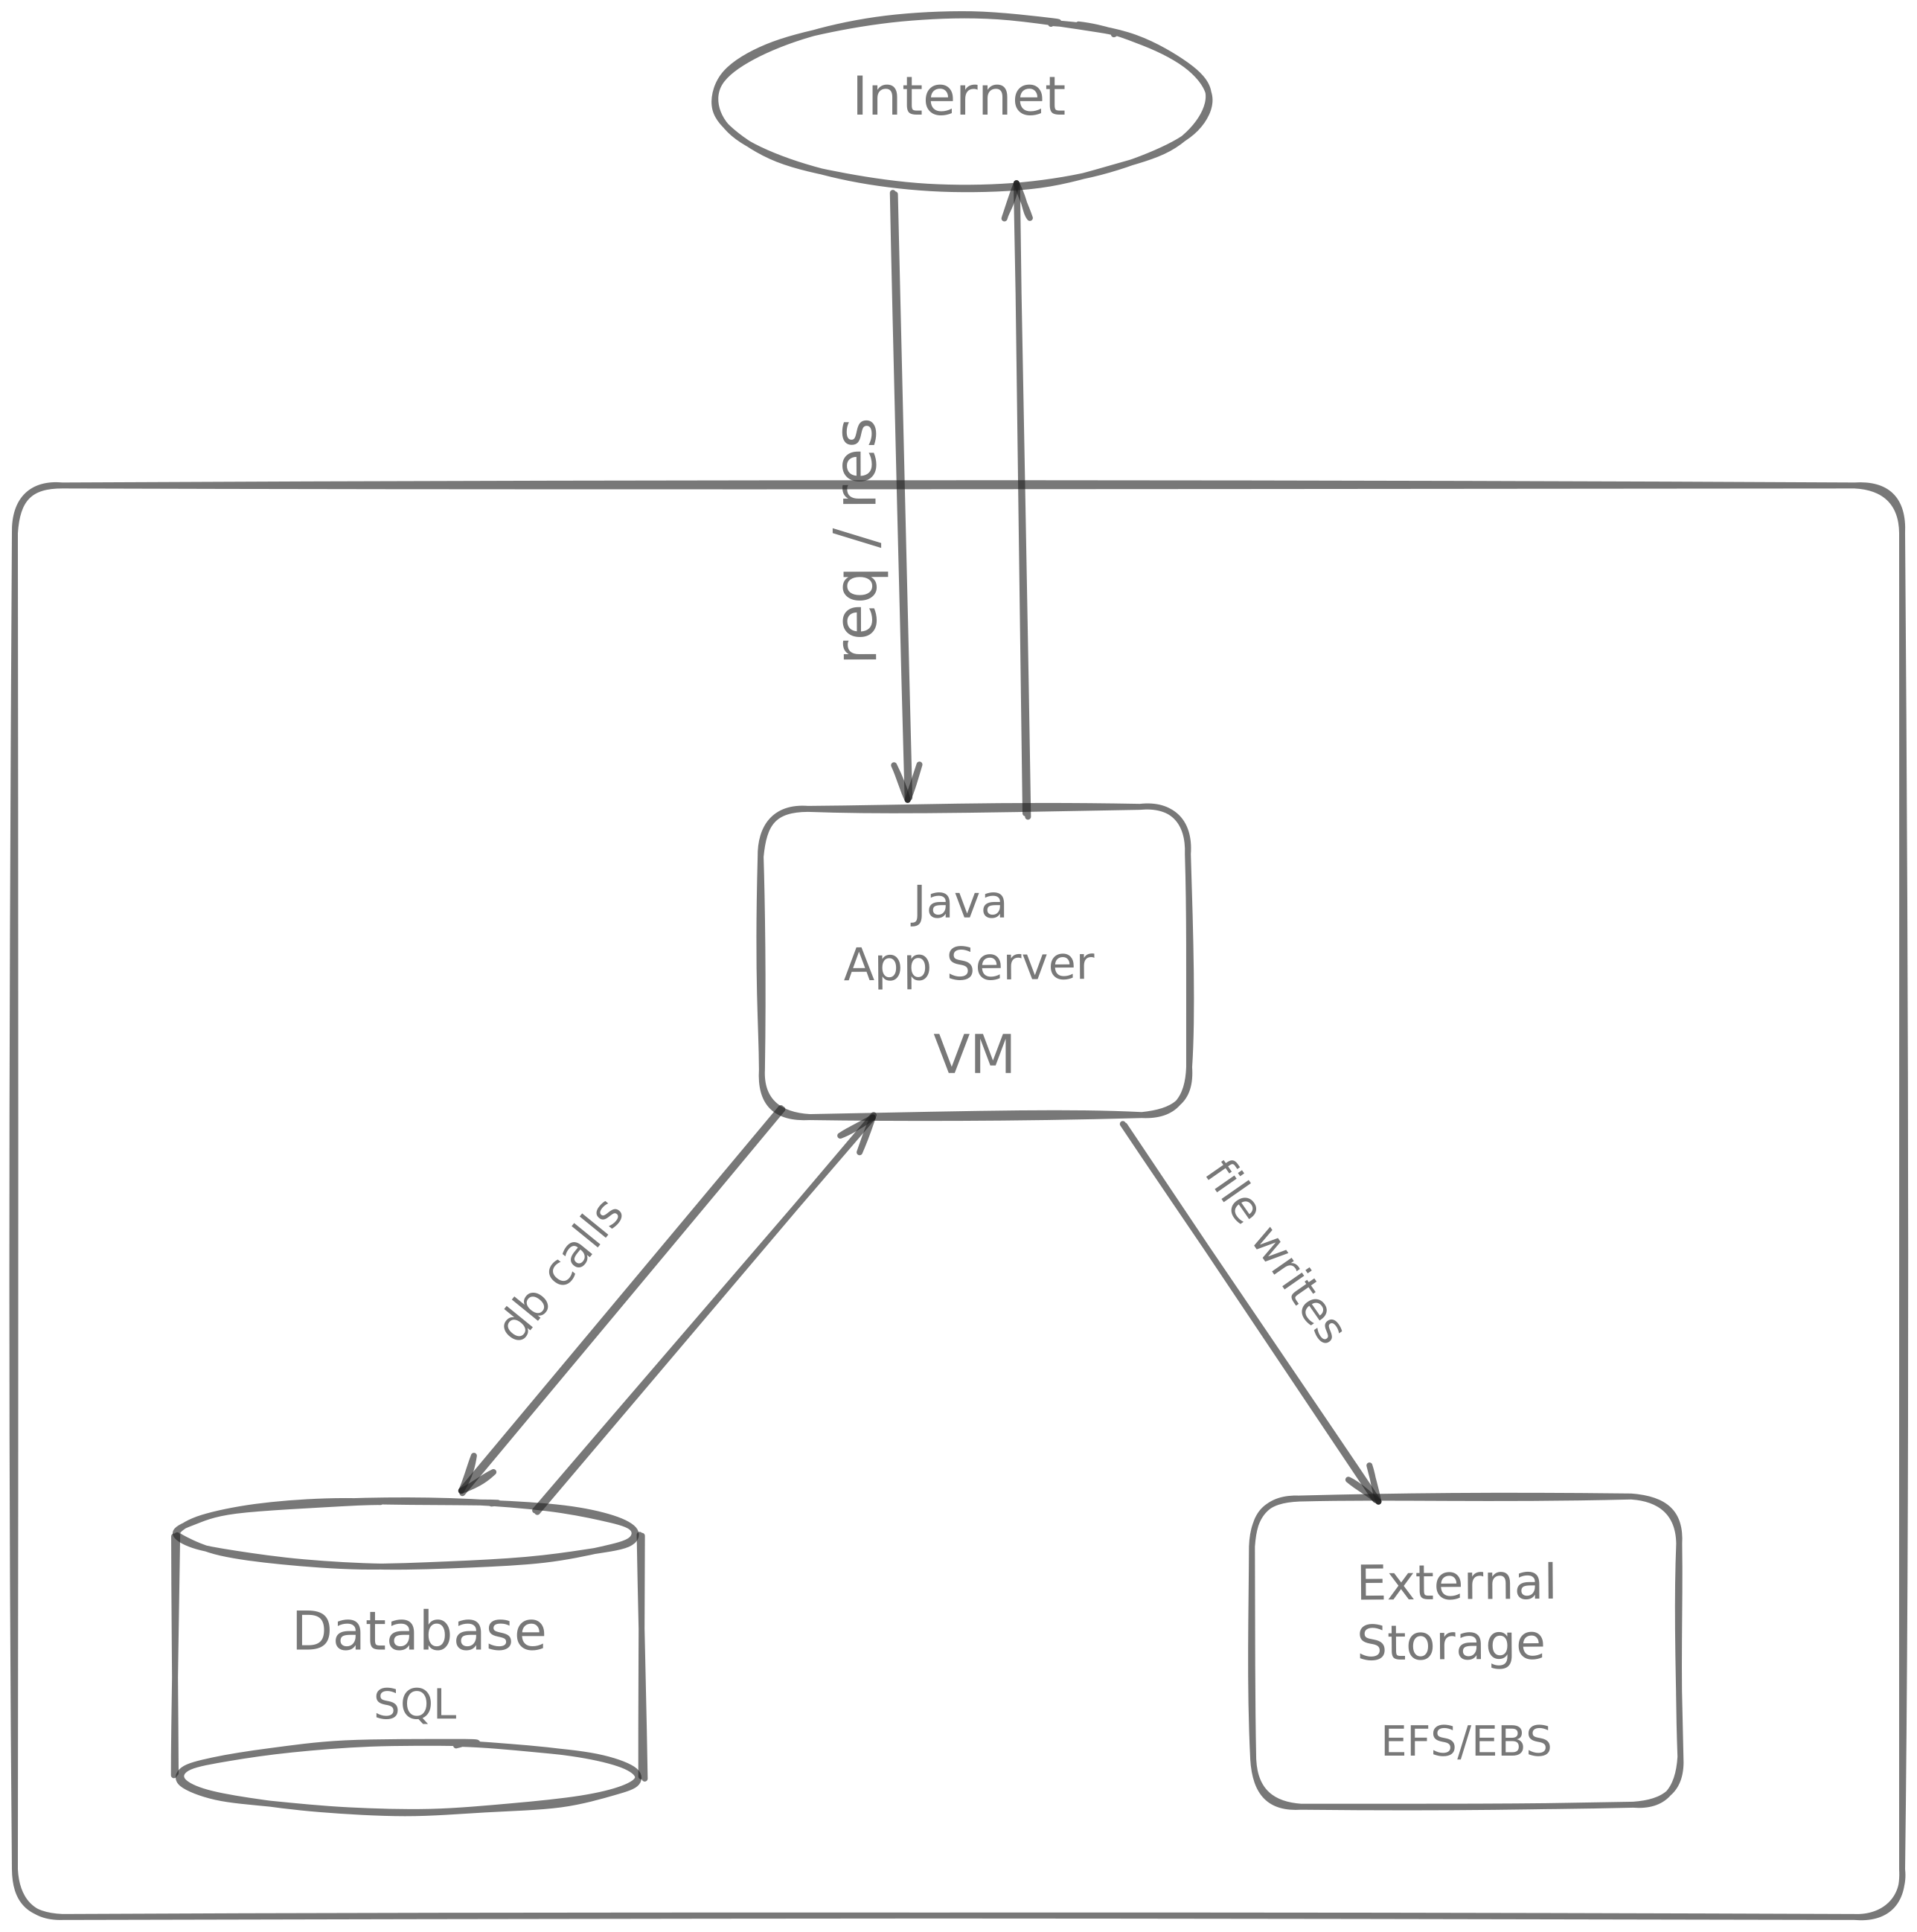
Consider this to be the architecture of the application that we are going to analyse. We choose the app server to be written in Java, as most SaaS applications are written in java historically.
Components of the architecture are :
- Java application server deployed in a linux virtual machine (Linux is the obvious choice).
- An SQL database which the application uses to store and retrieve data. (Postgres can be the choice as it is open source).
- An External Storage to which the app server writes the file. (Elastice File System or Elastic Block Storage in AWS).
Working of the application :
- User sends a /create http request to the application.
- Server sends a response back with PROCESSING STARTED status and a unique ID.
- Appliction reads data from a table in the database.
- Application writes the data as a file into the external storage.
- If user sends an http GET request with the unique ID to /status?id=<unique_id> api, it returns the current status of the file write operation.
- Once the file is written to external storage the status woule be COMPLETED.
Problem Statement
Suppose it takes 10 minutes for the request to get completed.
- How do we know which operations contributed to this total time ?
- How do we analyse the performance of the system ?
- Can we reduce time to increase the overall efficiency ?
To answer these questions, we need to explore ways to measure the factors that contribute to the total request latency. Before considering scaling the system, it is essential to understand how it performs in its current state.
System can only be optimised if we measure the time and resources it consumes now - The proof that justifies the current performance.
CPU Bottlenecks
From the architecture it is evident that the application does I/O heavy operations. It reads data from the database and writes the data to external storage as files. Based on this design, we can infer that the CPU may remain idle while waiting for I/O operations to complete. Once the data is available, the application likely performs deserialization and serialization before writing it to storage. To validate this hypothesis we can check few things :
Thread Dump Analysis
A thread dump is useful for identifying which operations are preventing the CPU from being utilized efficiently.
Note: Thread dump gives the snapshot of threads executing in the VM along with its thread state.
JDK offers multiple tools to get the thread dump, of which jcmd is a prominent one.
#This command lists the java process id's active
> jps
1234 app.jar
#This command will get the thread dump for the application
> jcmd 1234 Thread.print -l >> thread_dump.txt
By analyzing the thread dump, we can determine:
- Threads blocked on I/O
- Threads waiting on locks
- Threads stuck in long-running computations
CPU Profiling
CPU profiling provides a hoslistic view of CPU time consumed by the application. Tools like Java Flight Recorder(JFR) and async profiler can be utilised for this.
JFR
JFR can be used while the application starts.
> java -XX:StartFlightRecording=filename=recording.jfr,duration=2m,settings=profile -jar app.jaror it can be used with jcmd command
> jps
1234 app.jar
# start profiling
> jcmd 1234 JFR.start name=MyRecording filename=recording.jfr settings=profile
# stop profiling
> jcmd 1234 JFR.stop name=MyRecording
Tools like Java Mission Control or Intellij IDEA can be used to analyse the jfr file created after profiling. By enabling JFR we can observe a spike in CPU usage - usaually it is harmless.
With JFR, you can observe:
- CPU usage patterns
- Thread activity and contention
- Hot methods (most CPU-consuming code paths)
async profiler
This tool can be used to generte flame graphs to drill down deeper and identify the issues precisely.
>jps
1234 app.jar
# Wall clock profiling
> ./profiler.sh -e wall -d 60 -f wall.html 1234
# CPU with Kernal profiling
> ./profiler.sh -e cpu -k -d 60 -f cpu.html 1234
# Lock profiling
> ./profiler.sh -e lock -d 60 -f lock.html 1234
# Context switch profile
> ./profiler.sh -e cs -d 60 -f cs.html 1234
# Exception profiling
> ./profiler.sh -e exception -d 60 -f exception.html 1234
Memory Bottlenecks
Every program requires memory for execution. An application becomes susceptible to memory leaks or memory exhaustion when allocated objects are not garbage collected because references to them still exist within the program. As a result, the system may eventually become incapable of serving new requests. This is a common problem in java applications. This can be analysed by the following methods :
Heap Profiling
JFR can also be used for heap profiling, it gives insights on memory allocation, GC and heap usage trends. More specific results can be obtained using async profiler.
async profiler
>jps
1234 app.jar
# For allocation profiling
> ./profiler.sh -e alloc -d 60 -f alloc.html 1234
# Memory profiling
> ./profiler.sh -e mem -d 60 -f mem.html 1234
These profiles help identify:
- High allocation rate code paths
- Objects contributing most to memory usage
- Potential sources of memory pressure
Heap Dump Analysis
A heap dump provides a complete snapshot of how the application is utilizing memory at a given point in time. It provides full object graph,reference chains, retained size, leak root analysis etc
Heap dump can be collected using jcmd :
> jps
1234 app.jar
> jcmd 1234 GC.heap_dump filename=heap_dump.hprof
Tools like VisualVM and Eclipse Memory analyser(MAT) can be used to analyse hprof files (heap dump).
Memory bottlenecks typically arise due to:
- Memory leaks (unreleased references)
- High object allocation rates
- Inefficient data structures
- Excessive garbage collection pauses
Storage/Disk I/O Bottlenecks
IO related issues will definitey standout in the profiling results that we analysed before. A high I/O wait time typically results in threads being in BLOCKED or WAITING states.
External storage I/O related issues are often un-noticed, especially if cloud services such as EFS or EBS are used. Usually we expect that read/write operations works seamlessly under high load. This is a common misconception. In reality, storage systems have limits, and exceeding them can introduce significant latency. To ensure consistent performance the following paramaters must be considered :
- Throughput - It is the total amount of data that can be transfered per second.
- IOPS - The number of I/O operations that system can handle per second.
In the case of Elastic Block Store (EBS), the store throttles the data transfer if it exceeds the maximum throughput configured in the system and it will never allow more IOPS that the configured value.
When working with EFS, the behavior differs slightly, AWS offers three through put modes
- Bursting Mode
This is the most cost effective mode. The throughput increases with the increasing size of the storage. Bursting mode also rate limits the requests if the throughput consumption is beyond the threshold. If it consumes throughput it decreases the BurstCreditLimit - This is the key metric to monitor when you face unexpected latency due to I/O. BurstCreditlimit replenishes if throughput consumption is less. - Provisioned Mode
Throughput can be configured while setting up the instance. Suppose 150MB/s is configured, system consistently provides this throughput. Operations are not rate limited in this mode (BurstCreditlimit need not be considered), but if the applicaiton transfers data more than 150MB/s then you see a delay in the total timings. - Elastic Mode
This is the pay as you go mode. Throughput scales propotionally with increasing load. Throttling related problems are not common in this mode.
Cloud providers like AWS offers tools like Cloudwatch to analyse the usage metrics of EBS and EFS. Users can even set alarms if a metric crosses the desired limit. Thoughput and IOPS are definitely two metrics that can be looked closely to find issues related to disk operations.
Database Bottlenecks
If a managed database service such as RDS is used, it provides built-in metrics for performance analysis. In the case of on-premise databases, CPU, memory, and I/O profiling can be performed directly on the database server.
There are few common low level design issues which could lead to slowness.
-
Lack of connection pooling
If applicaiton establishes a connection for every new intteraction with the database,it leads to significant resource overhead due to GC, added network roundtrips,additional garbage collection pressure etc A better approach is to maintain a fixed pool of reusable connections. Connections are borrowed from the pool and returned after use. Libraried like hikari already abstracts this for developers. -
Long running queries
Queries can be long running if it scans the entire table to fetch the desired result. It is advised to analyse the query plan of the database query to measure the time elapsed. After analysis proper indexing, normalization or denormalization of tables, constructing optmised queries etc can be considerd to improve the timings.
Query performance analysis should be an ongoing activity, as performance characteristics can change with data growth. Indexes that were effective earlier may become suboptimal over time. -
N+1 Query problem
Mostly data required by the application would be residing in multiple tables within the database. When fetching related data,one query retrieves the parent records and additional queries are executed for each child record.For fetchig the required data we did additional N queries to resolve the values in its child table.In simple terms, this is N+1 query problem. Using joins or batch queries would help solve this. -
ORM misuse
Applicaion layer uses Object Relational Mapping frameworks to abstract database interactions. But sometimes the query generated by ORM could be inefficient. This can be identified by logging the queries generated by the library and comparing it with optimized manual queries.
There are additional strategies to improve database performance such as partitioning the tables, sharding the database, analysing the load balacer etc. These are not in the current scope as the focus here is on identifying and resolving bottlenecks within the existing architecture before scaling.
Conclusion
The purpose of the sample architecture was to present a blueprint of how components are integrated within a software system and to build intuition about the factors that contribute to performance degradation. Using the starting points discussed above, one can begin to systematically investigate what makes a system slow. Each component in the architecture exposes its own set of metrics, and the application serves as the entry point for this analysis. Through CPU and memory profiling, developers can identify sources of contention and inefficiency.
While this discussion focused on core system components, network-related factors were intentionally omitted. In real-world production systems, latency introduced by routing, TCP, DNS, and other network layers can also play a significant role. We also intentionally excluded distributed tracing, observability, and alerting mechanisms from the design. These are essential components in most production systems, as they help identify bottlenecks, but are beyond the scope of this blog.
Ultimately, performance optimization begins with measurement. Meaningful improvements can only be made by understanding how time and resources are consumed across the system.